Configuring Microsoft Sentinel on Azure Log Analytics to review threats from logs collected by the Azure Log Analytics from deployed Virtual Machines.


This article describes how to configure Microsoft Sentinel on Azure Log Analytics to review threats from logs collected by Azure Log Analytics from deployed virtual machines. This project was done by the cloud computing team 1 in the second week of the Sidehustle bootcamp.
Microsoft Sentinel is a Cloud-native solution that provides Security Information and Event Management (SIEM) and Security Orchestration, Automation and Response (SOAR).
Microsoft Sentinel natively incorporates Azure Log Analytics Workspace which is a unique environment where all the log data and security incidents generated by Azure monitors are stored. Azure log analytics makes it easier to manage the log data that is collected from various data sources like virtual machines.
REQUIREMENTS
- Two Azure Virtual Machines (Windows Server 2019) deployed in different locations in the same resource group.
- Azure Log Analytics deployed in one of the locations.
- Microsoft Sentinel deployed on the Azure log analytics.
STEPS TO FOLLOW
Create and deploy two virtual machines.
During the configuration, ensure that virtual machines are deployed in the same resource group but in different locations.
After successful validation and deployment, remote into the virtual machines to ensure that they are up and running.
Create a Log Analytics Workspace.
The Log Analytics Workspace should be deployed in the same resource group as the virtual machines and in the same location as one of the virtual machines. It should have a unique workspace ID and a resource ID.
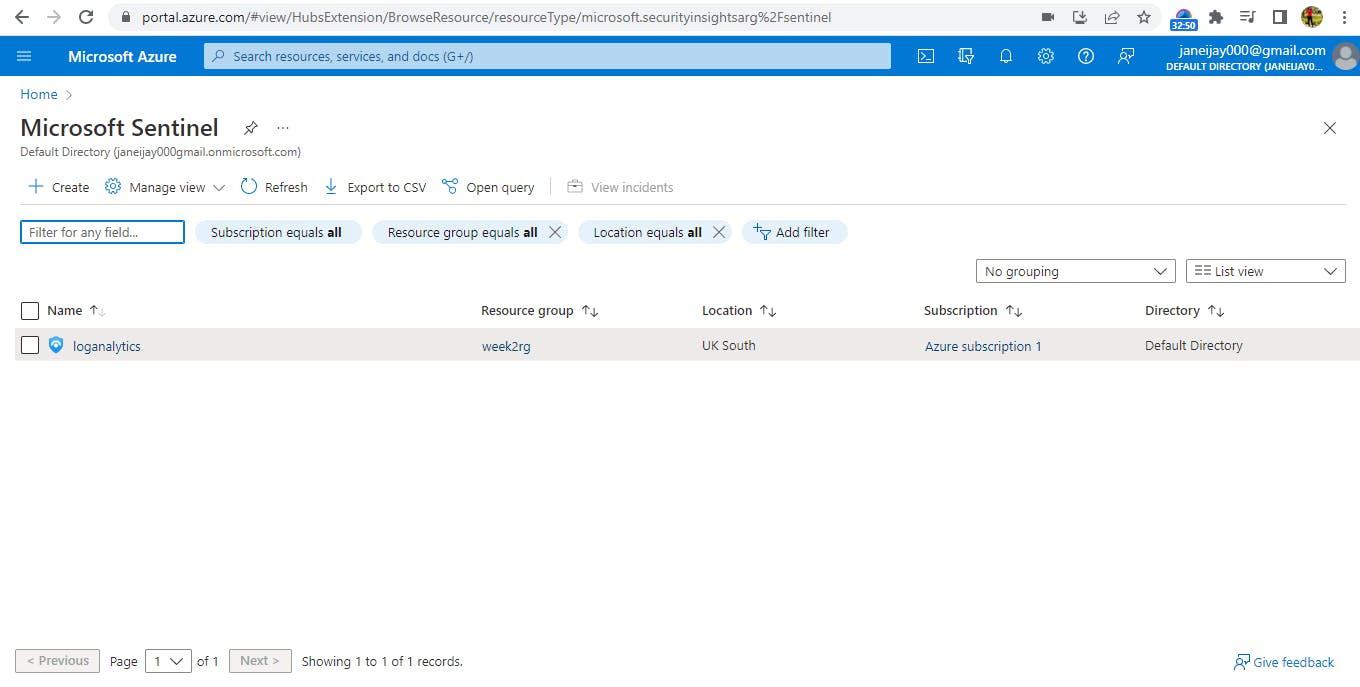
Deploy Microsoft Sentinel on the Azure log analytics.
In the Azure portal, search for Microsoft Sentinel. Click on ‘Create’. During the deployment, select the Log Analytics Workspace you created in Step 3 and add the workspace to Microsoft sentinel.
Configure Security Events in Microsoft Sentinel
To configure Microsoft Sentinel to collect security events from the security log in “event view” in the virtual machines, by the left blade under Configuration, select ‘Data connectors’.
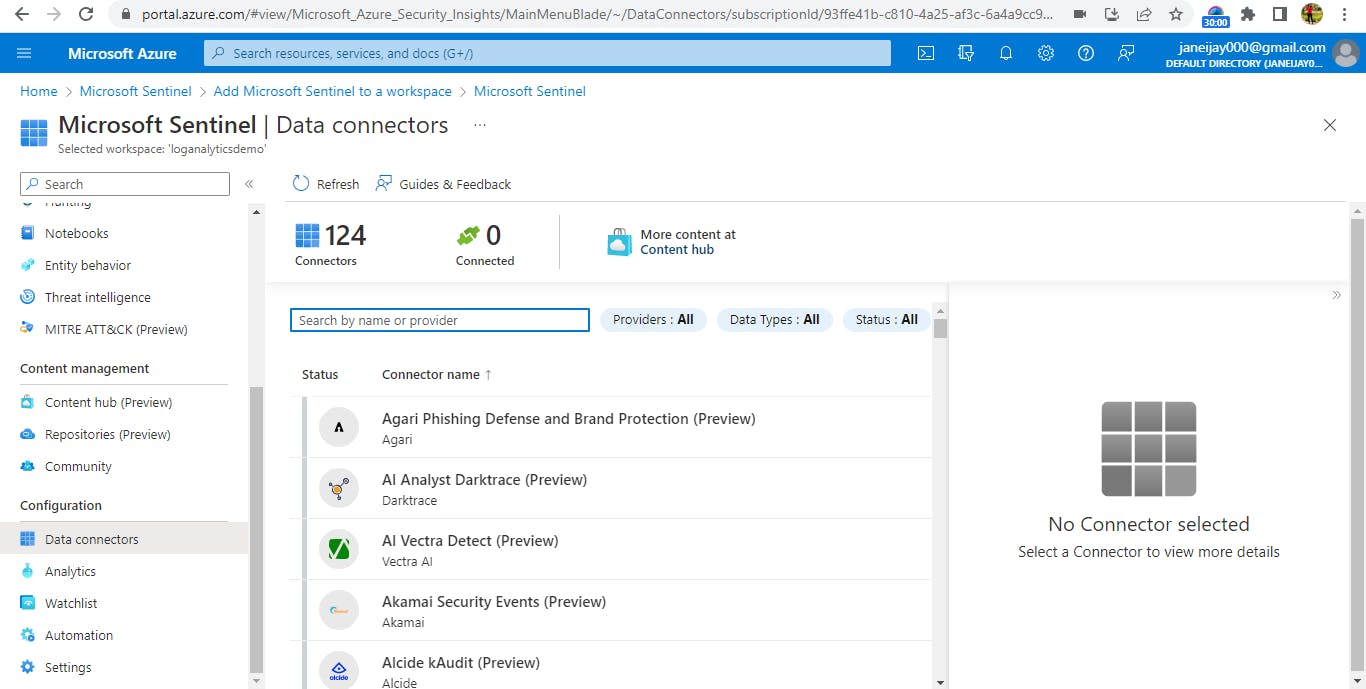
In the search bar, search for ‘Windows Security Events via AMA’. Click on it, and then click on ‘create’ to create data collection rule.
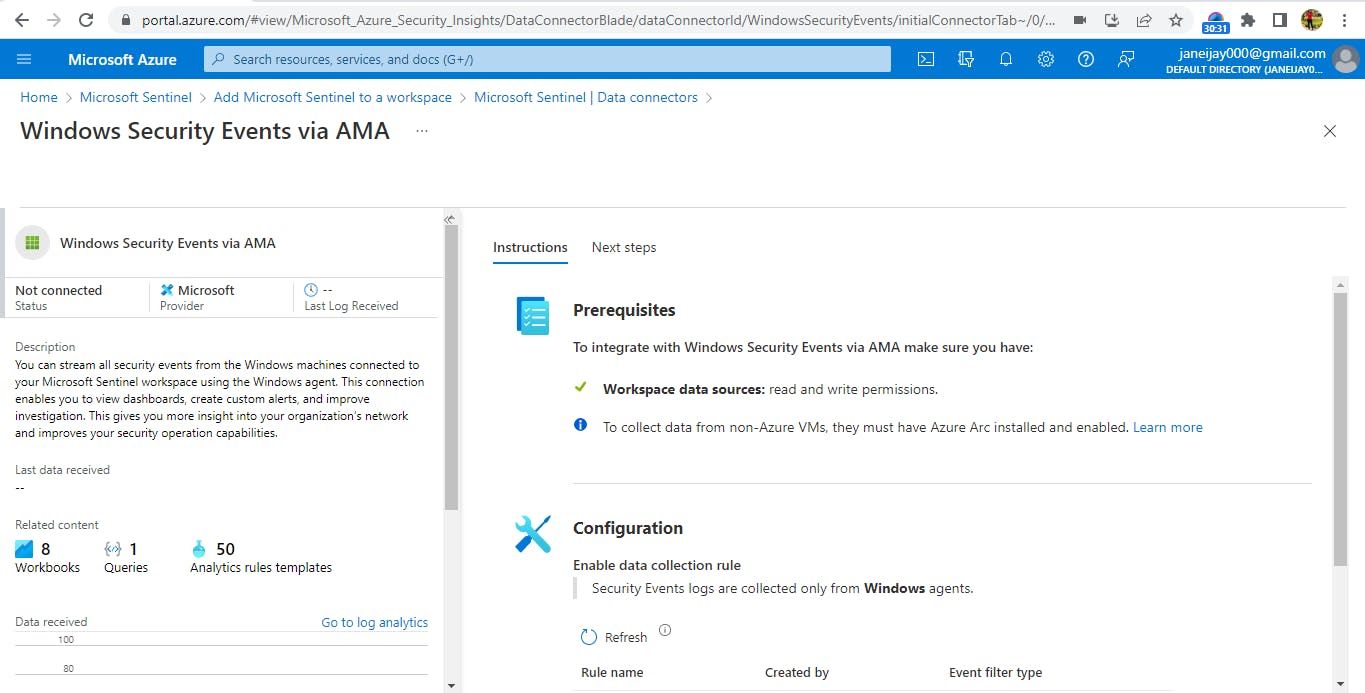
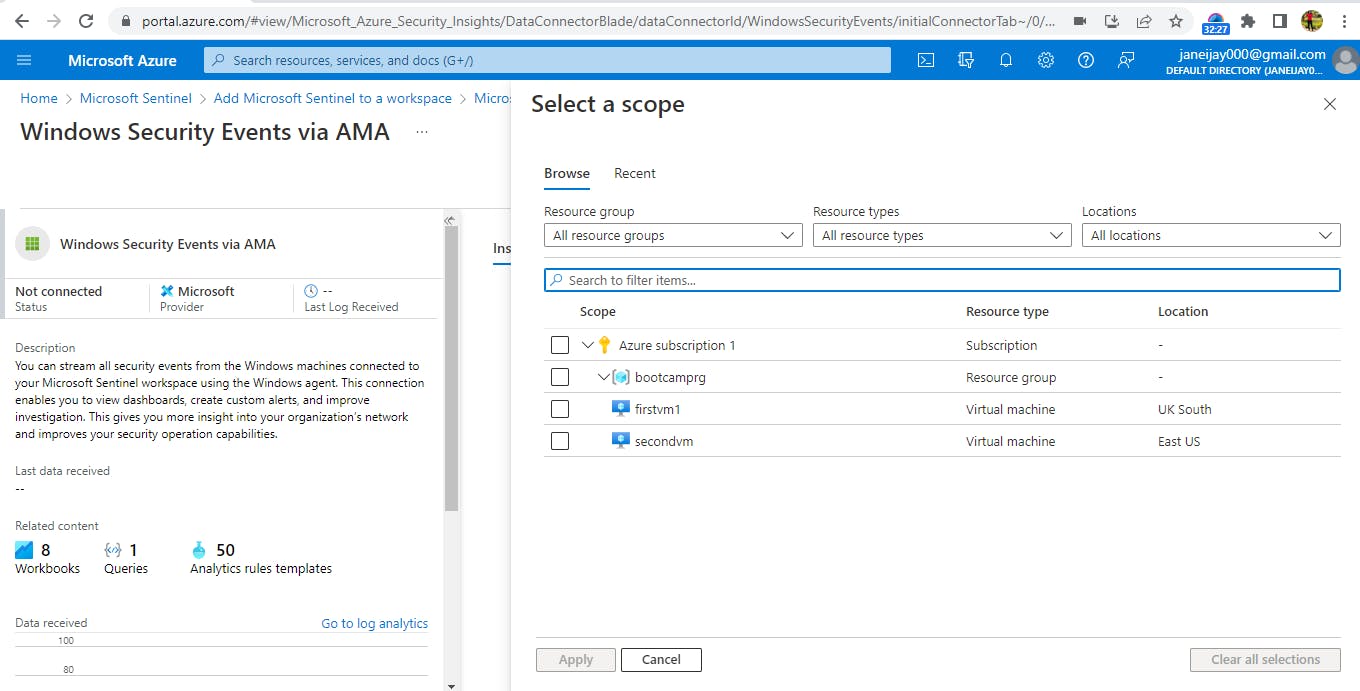
Give it a name, then click next to add ‘resources’. Select the two virtual machines which you created, then click ‘apply’, ‘review and create’ and then ‘create’.
Reviewing Security threats on the virtual machine.
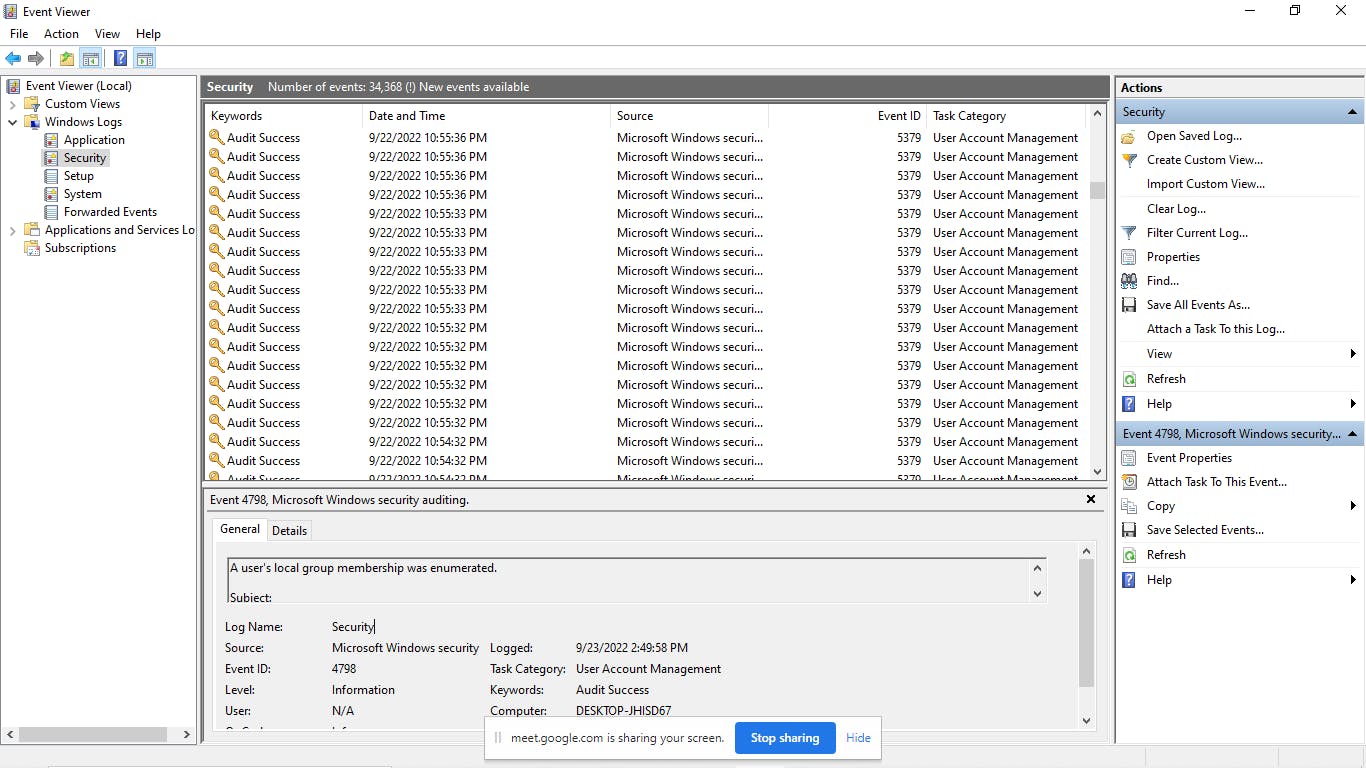
In the second virtual machine (or any vm of your choice), go to event viewer and click on security at the top left. This shows all the security logs for the virtual machine. If there is an ‘Audit failure’, it means that a defined action has failed to complete successfully and needs to be investigated. Click on the audit failure and scroll down to get the EventID.
In Microsoft Sentinel on the Azure portal, duplicate the tab to be able to work with different resources at the same time.
On a third tab, search for ‘Monitor Service’ in the portal. Click on it and go to ‘Activity logs’. Export activity logs and then add diagnostic settings. Check the boxes for ‘Administrative’, ‘Security’ and ‘Send to log analytics workspace’. Give the settings a name and click ‘save’.
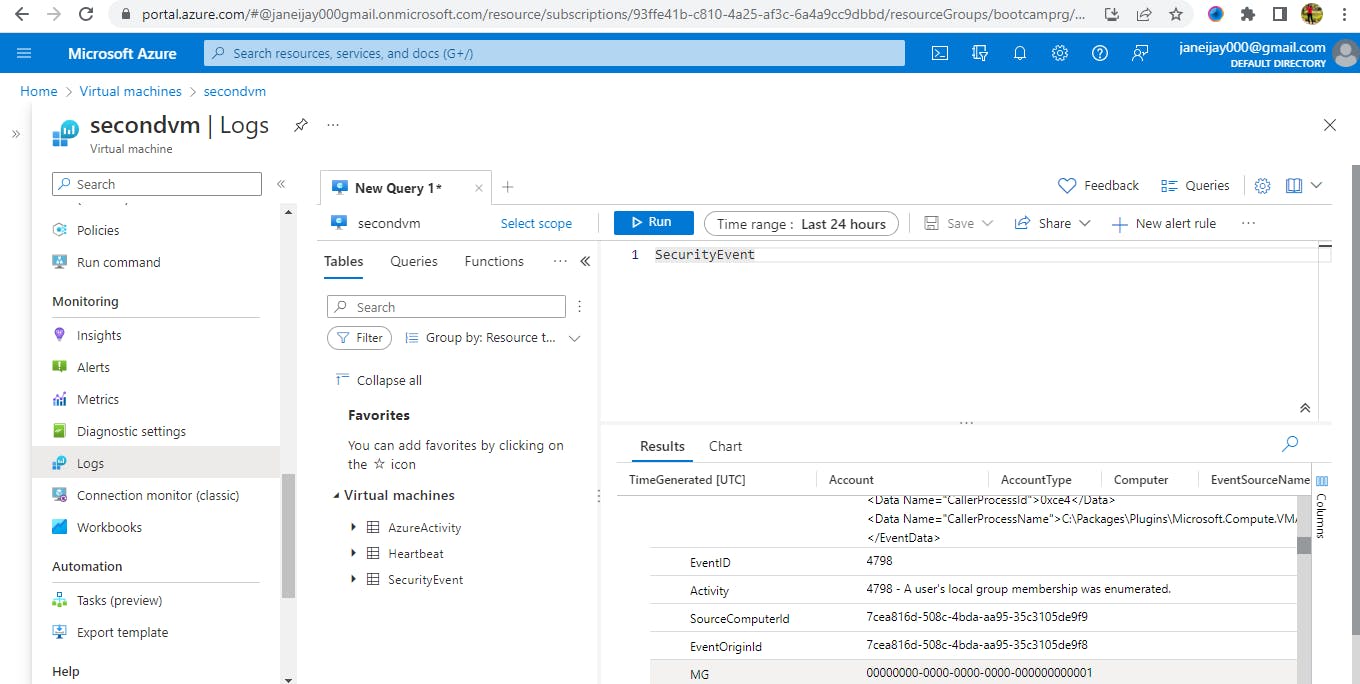
On the second tab, go to resource group, then to ‘Log analytics’, click ‘logs’ by the left and then the dropdown for ‘Microsoft Sentinel’ and then click on ‘Security Event’.
Type the query ‘SecurityEvent’, change the time range to 1hr and run it. Refresh the page.
In the result section, the security events logged from the virtual machines is displayed here. So instead of going into multiple virtual machines to view security events, all the events are collected by the Log Analytics and displayed on Microsoft Sentinel.
Configure Microsoft Sentinel for Incidents.
In the Microsoft sentinel tab, create a 'scheduled query rule’. Give it a name. For tactics, select ‘Initial Access’ and tick the privilege escalation checkbox.
Select Next: Set rule logic. Type the query. Then under entity mapping, for entry type, select ‘add new entry’. For identifier, select ‘address’ and then for value, ‘CallerAddress’. Then add new entry. Entry type, select ‘Accounts’. For identifier, ‘Object Guid’ and for value, select ‘caller’. For event grouping, trigger an alert for each event. Then review and create.
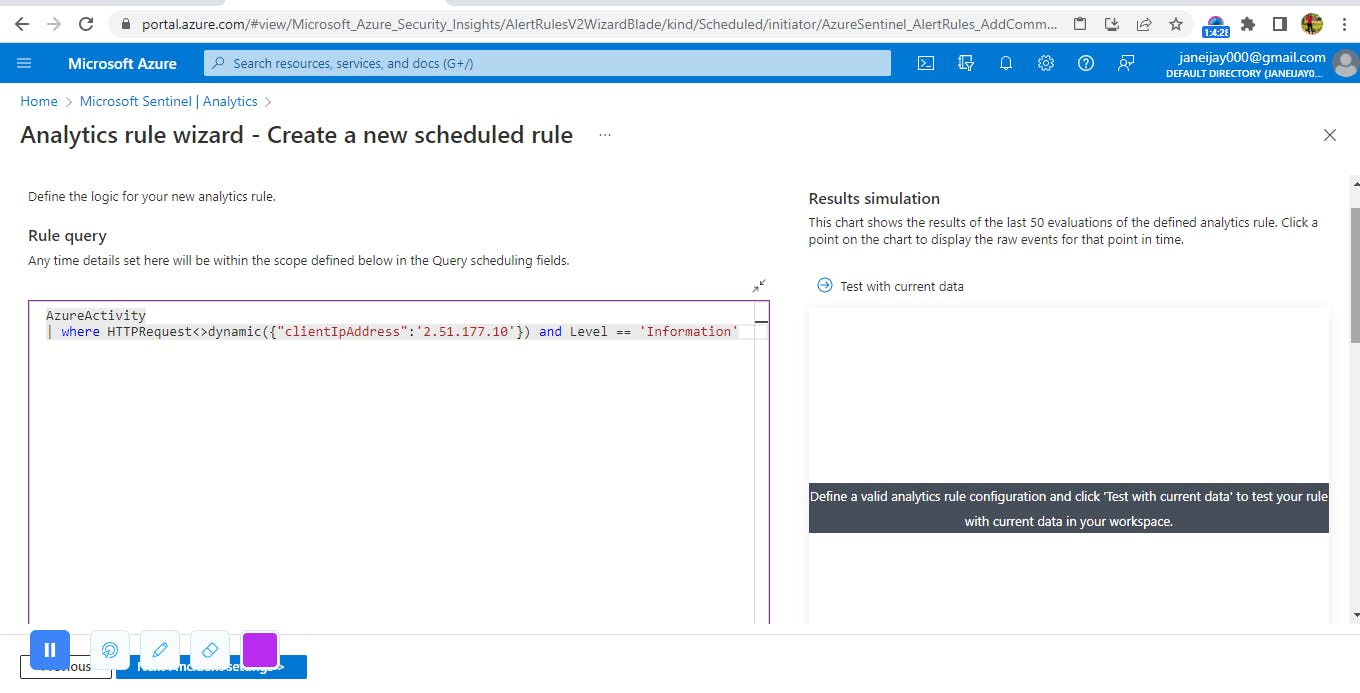
Back to the log analytics tab, in log management, select Azure Activity.
Type the query: AzureActivity and run it. When the results come up, click on the drop down for an administrative task to confirm that the caller IP address is different from that of the virtual machines.
Then go into the virtual machine and get the event ID from an audit failure that has been logged.
Under the dropdown for Microsoft sentinel in the Log analytics tab, select ‘security event’. Then run the query to get the IP address of the unknown device using the event ID.
Next, go back to the Microsoft sentinel tab. In the overview page, select ‘recent incident’. Then select Azure Activity Alert. Then click on the ‘similar incidents preview’. View full details to get a detailed description of the IP address and geographical location of where the security threat is coming from.
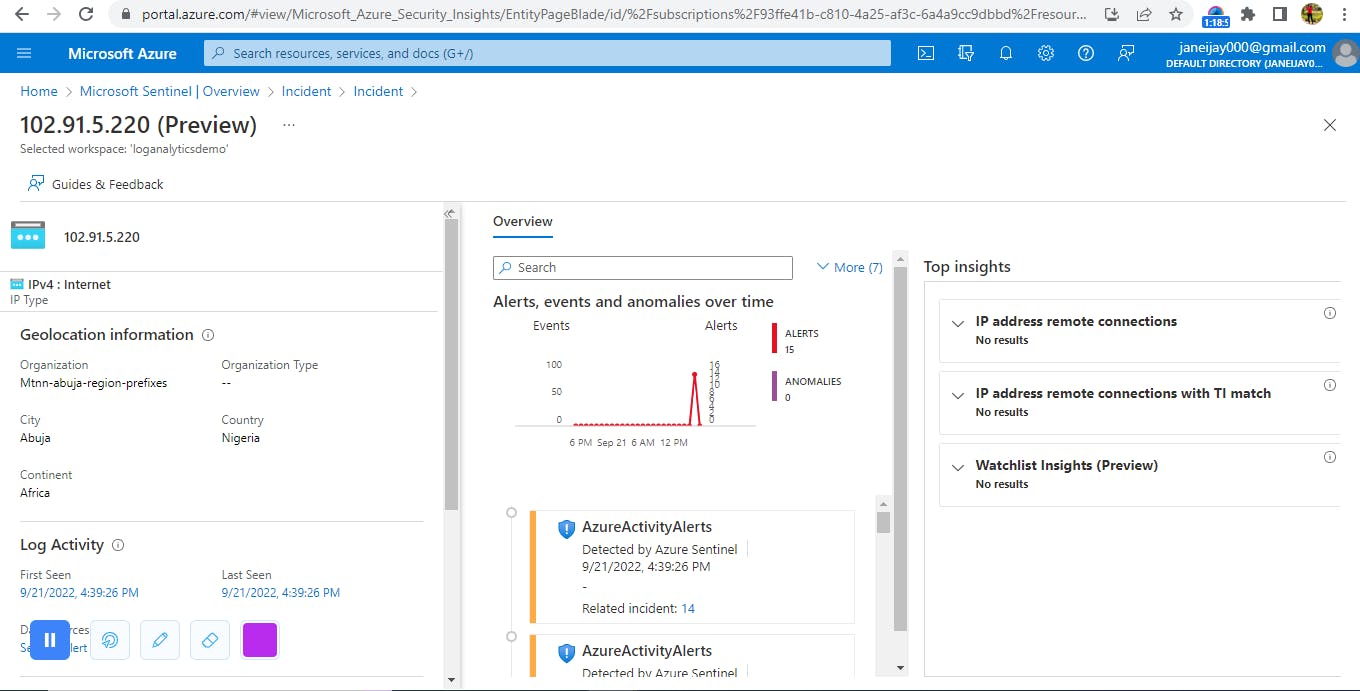
Click on the IP address and then select ‘Investigate’ to get a graphical view of the incident and to see similar incidents.
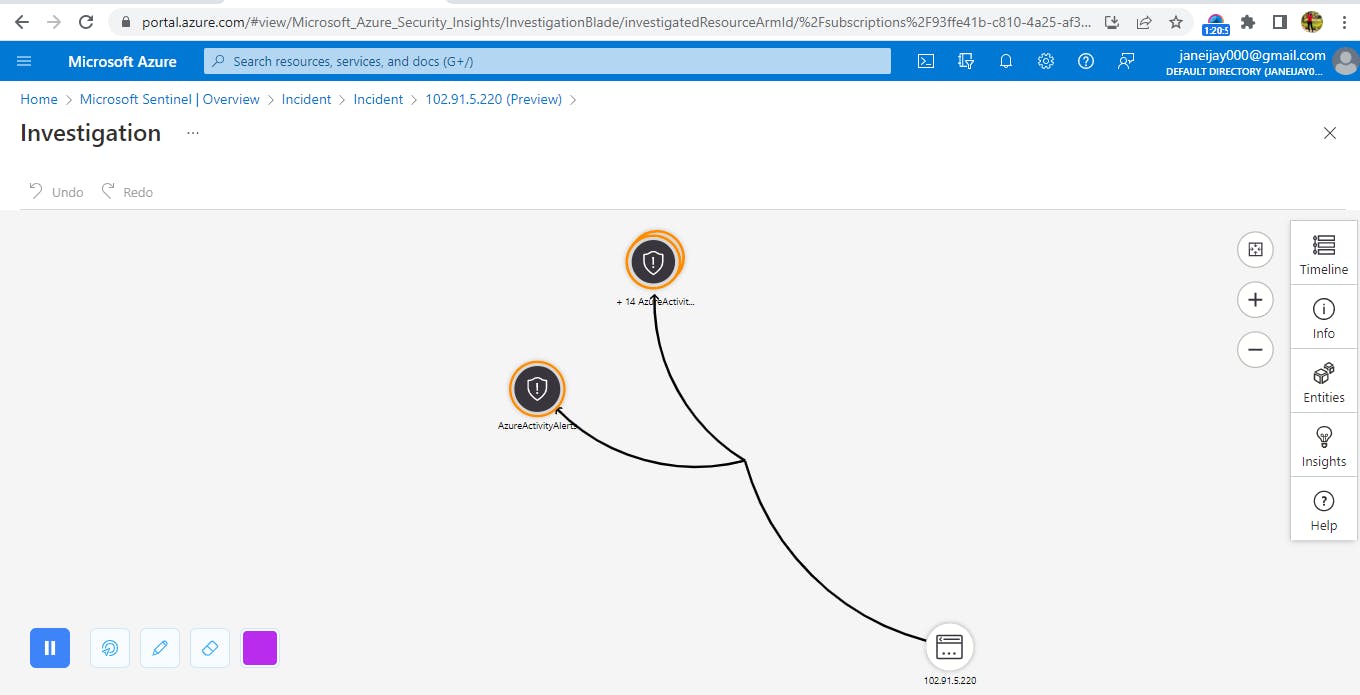
In conclusion, while using sentinel to review for threats, we discovered a login attempt from an unknown source, with the IP address of '102.91.5.*' and location Abuja, Nigeria. Microsoft Sentinel can be used to identify security events which can then be used by the security team for investigation for further action.